Key Takeaways
- Definition: A Key Performance Indicator (KPI) in sales is a quantifiable measure used to evaluate the effectiveness of a sales organisation in achieving its core business objectives. It provides an objective, data-driven assessment of performance.
- Leading vs. Lagging: KPIs are categorised as either leading indicators (inputs like meetings booked) that predict future outcomes, or lagging indicators (outputs like total revenue) that measure past results. A balanced framework requires both.
- Core B2B KPIs: Foundational metrics for predictable revenue include Monthly Sales Growth, Sales Target Attainment, Average Deal Size, and Sales Cycle Length.
- Profitability Focus: For sustainable scaling, advanced financial KPIs like Customer Acquisition Cost (CAC) and Customer Lifetime Value (CLV) are non-negotiable. The CLV-to-CAC ratio is the ultimate measure of a B2B business's economic viability.
- Implementation Framework: Effective KPI implementation requires strict alignment with business objectives, a "less is more" approach to metric selection, and a single source of truth for data integrity, typically managed by a Revenue Operations function.
A Key Performance Indicator (KPI) in sales is a specific, measurable value that assesses how effectively a sales organisation is achieving its most critical business objectives. In B2B environments, KPIs are not just metrics; they are the vital signs of the revenue engine, providing actionable data to diagnose performance, forecast future outcomes, and make strategic decisions that directly impact ROI.
What a Sales KPI Actually Does
A sales KPI provides strategic clarity by isolating the critical metrics that predict revenue from superficial "vanity metrics" that merely track activity. This distinction is fundamental for making decisions that drive profitable growth. For a sales leader, KPIs function like an aircraft's instrument panel, focusing attention on the essential data points—such as altitude, speed, and fuel—required to reach a destination safely.
For UK B2B companies, a robust KPI framework must track both short-term performance and long-term value drivers to ensure sustainable growth. The most effective sales KPIs include monthly sales growth, average profit margin, and sales target attainment. These metrics deliver a real-time assessment of performance, eliminating the need to wait for end-of-quarter reports. For a deeper analysis of these metrics, our guide to sales KPIs offers a comprehensive overview.
Leading vs. Lagging Indicators
To effectively manage performance, it is critical to differentiate between two primary types of sales KPIs: leading and lagging indicators. Each serves a distinct but equally important function in a strategic performance framework. Leading indicators are predictive inputs you can control, while lagging indicators are historical outputs you can only review.
| Indicator Type | Definition | B2B Examples | Strategic Function |
|---|---|---|---|
| Leading | Input metrics that track controllable activities predictive of future success. | Calls Made, Meetings Booked, Proposals Sent, Pipeline Coverage Ratio. | Proactive management; allows for course-correction and coaching to influence future results. |
| Lagging | Output metrics that measure historical results and confirm past performance. | Total Revenue, Customer Acquisition Cost, Average Deal Size, Win Rate. | Confirms the outcome of past strategies; validates if previous efforts were successful. |
A high-performing sales organisation doesn't just measure the destination (lagging indicators); it meticulously tracks the journey (leading indicators). Focusing only on revenue is like trying to navigate by looking in the rearview mirror.
For mid-market enterprises aiming to scale, tracking activity-based leading indicators is essential. Monitoring the number of business development calls, qualified meetings held, and proposals sent allows for rapid diagnosis of performance issues. This insight enables proactive coaching and transforms performance management from a reactive quarterly review into a forward-looking, results-driven process.
Tracking the Core KPIs for Predictable B2B Revenue
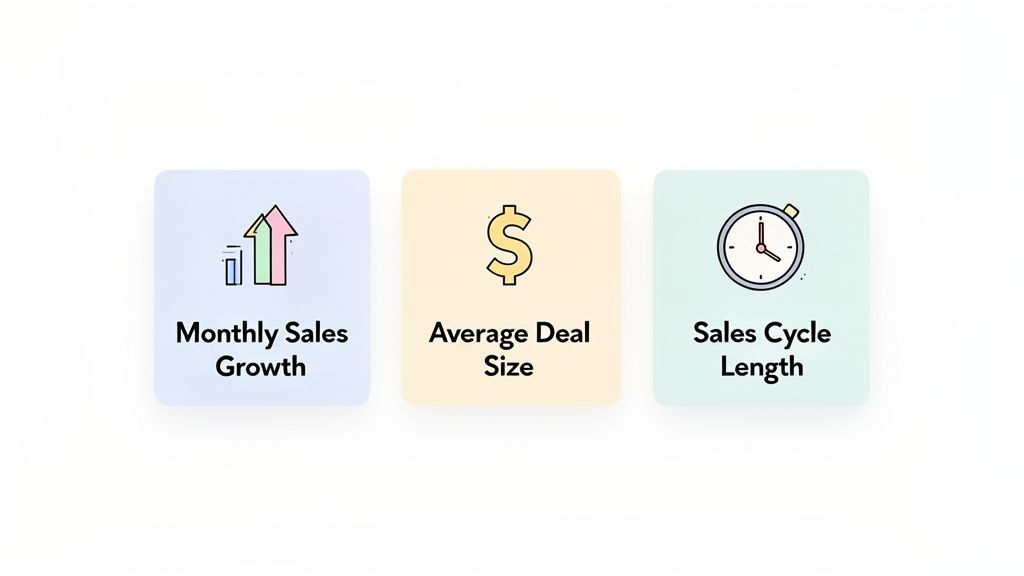
To build a predictable revenue engine, a sales organisation must consistently track a core set of foundational KPIs that provide an accurate, real-time picture of performance. These metrics serve as a diagnostic toolkit, enabling leaders to move beyond intuition and understand the interconnected health of the entire sales operation. Consistent monitoring of KPIs like Monthly Sales Growth, Sales Target Attainment, Average Deal Size, and Sales Cycle Length reveals patterns, identifies problems before they escalate, and informs strategic decisions that drive growth.
These core indicators are the language of sales performance, articulating the efficiency of the team, market response, and the financial viability of the go-to-market strategy. A performance decline in one KPI often signals a corresponding issue in another, providing leaders with the necessary data to ask incisive questions and take corrective action.
Monthly Sales Growth
This KPI measures the month-over-month percentage change in total sales revenue, serving as a fundamental gauge of business momentum. It answers a critical question: is the business accelerating, stalling, or contracting? For any B2B company, consistent positive growth signifies strong product-market fit and effective sales execution, while flat or negative growth is an early warning indicator requiring immediate investigation.
- Formula:
((Current Month's Sales - Previous Month's Sales) / Previous Month's Sales) x 100 - ROI-Focused Insight: A high growth rate validates current strategies. A declining rate may signal market saturation, increased competition, or process inefficiencies. This KPI is critical for accurate forecasting and strategic resource allocation.
Sales Target Attainment
Sales Target Attainment directly measures team performance against established goals, reflecting the organisation's ability to deliver on commitments. It is a primary metric reviewed by executive leadership to assess the health of the sales function. Calculated as a percentage, 100% attainment indicates the team has met its goal, while a lower figure highlights a performance gap requiring intervention.
Tracking attainment in real-time is the key to proactive management. Finding out you’ve missed the quarter by 20% on the last day is a failure of leadership. Identifying a negative trend in week three, however, gives a manager time to step in with coaching and support.
This metric is vital for both individual performance reviews and assessing overall team health. Consistently missed targets across the team often point to systemic issues, such as unrealistic goals, inadequate training, or a flawed sales process. Often, improving performance requires initiatives to improve sales productivity.
Average Deal Size
This KPI calculates the average revenue generated from each closed-won deal, providing a critical metric for forecasting revenue and understanding customer lifetime value. An increasing Average Deal Size indicates improved upselling, cross-selling, or a successful move upmarket to larger clients. Conversely, a downward trend may suggest excessive discounting or a shift toward smaller, less profitable customer segments.
- Formula:
Total Value of New Sales / Number of Deals Closed - ROI-Focused Insight: This KPI is most powerful when analysed alongside Sales Cycle Length. For instance, if Average Deal Size increases by 30% while the Sales Cycle Length doubles, it likely indicates a shift toward more complex enterprise sales, justifying the creation of a dedicated enterprise team or process refinements.
Sales Cycle Length
Sales Cycle Length measures the average time from initial lead contact to a closed deal, serving as a primary indicator of sales process efficiency. A shorter sales cycle directly improves cash flow and increases sales capacity by allowing reps to pursue more opportunities. A lengthening sales cycle is a significant red flag, potentially indicating an overly complex buying process, ineffective lead qualification, or internal bottlenecks.
- Formula:
Total Number of Days to Close All Deals / Number of Deals Closed - ROI-Focused Insight: By monitoring this KPI, leaders can pinpoint where deals are stalling in the pipeline. This data-driven insight allows for targeted process improvements or additional training to accelerate deal velocity and revenue recognition.
Measuring Profitability with Advanced Financial KPIs
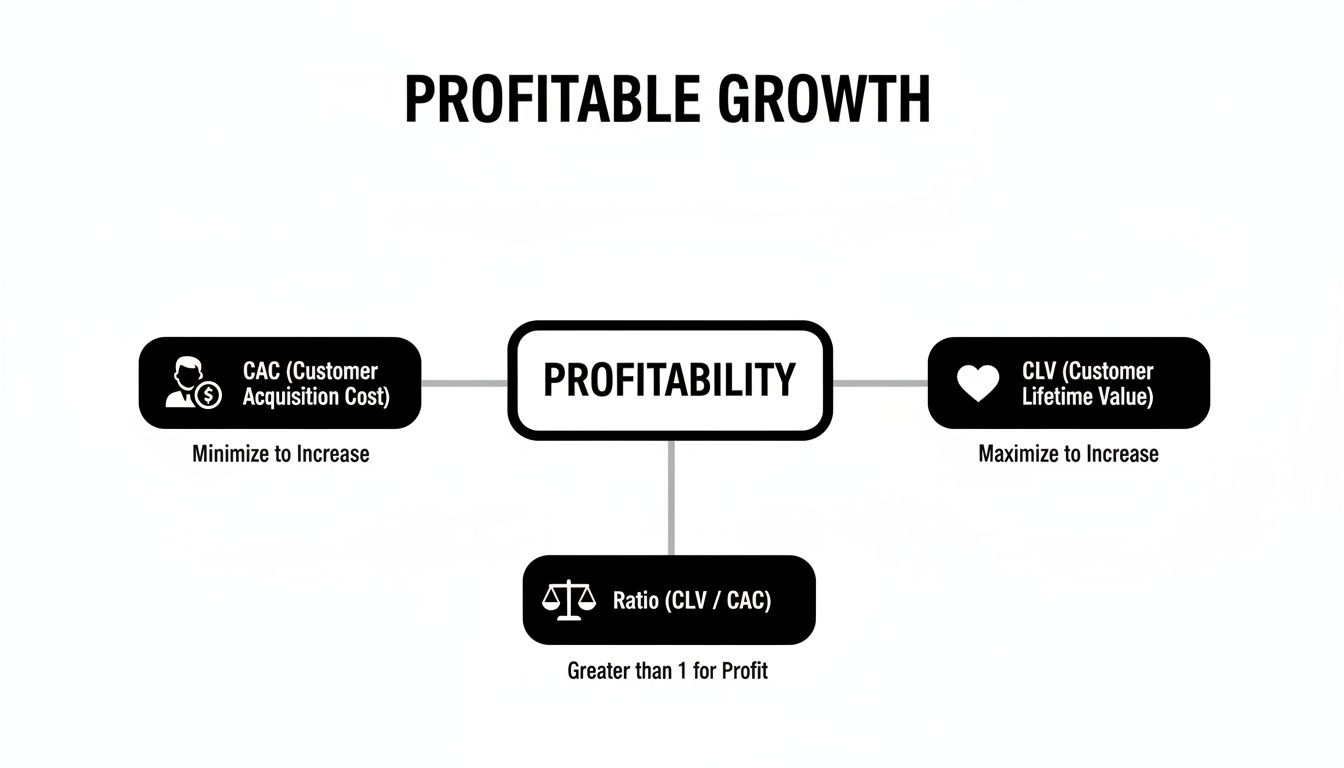
Revenue growth without profitability is an unsustainable strategy that builds a more expensive, inefficient organisation. The true measure of a scalable B2B business lies in KPIs that assess financial efficiency and the genuine return on investment of sales and marketing efforts. Moving beyond top-line revenue, advanced financial KPIs like Customer Acquisition Cost (CAC) and Customer Lifetime Value (CLV)—and the critical ratio between them—determine whether each new customer contributes positively to the bottom line.
A focus on profitability distinguishes companies that scale sustainably from those that pursue growth at any cost. Rapid expansion can mask an inefficient sales process or an unsustainable customer acquisition model. A firm command of financial KPIs provides the clarity required to build a resilient, long-term business where growth is both strong and profitable. These metrics answer critical questions for every RevOps leader: Are acquisition costs too high? Are customers retained long enough to generate value? Is our growth model economically viable?
Calculating Customer Acquisition Cost (CAC)
Customer Acquisition Cost (CAC) measures the total cost to acquire a single new customer. A comprehensive CAC calculation must include all sales and marketing expenses—salaries, commissions, software, and overheads—from a specific period. A low and stable CAC is a clear indicator of an efficient go-to-market engine.
- Formula:
(Total Cost of Sales + Total Cost of Marketing) / Number of New Customers Acquired - ROI-Focused Insight: Tracking CAC is fundamental to understanding unit economics. A rising CAC can signal market saturation, heightened competition, or inefficient spend. A healthy CAC is one that can be recouped within a reasonable timeframe by the value a customer generates. For example, if £50,000 in sales and marketing spend acquires 50 new customers, the CAC is £1,000 per customer.
Assessing Customer Lifetime Value (CLV)
Customer Lifetime Value (CLV) projects the total revenue a business can expect from the average customer over the duration of the relationship. This KPI shifts focus from a single transaction to the long-term health and profitability of the customer base. A high CLV is a strong indicator of product-market fit, customer satisfaction, and an effective retention strategy, enabling more informed decisions about acquisition spending.
- Formula:
(Average Purchase Value x Average Purchase Frequency) x Average Customer Lifespan - ROI-Focused Insight: A high CLV provides the financial justification for more aggressive investment in growth. If a typical customer generates £10,000 in lifetime value, a CAC of £2,000 represents a sound investment.
The ultimate goal for any B2B or subscription business is to get to a point where the revenue from existing customers can fund the acquisition of new ones. CLV is the KPI that tells you if that dream is even possible.
The Golden Ratio: CLV to CAC
The CLV to CAC Ratio is arguably the single most important metric for assessing the long-term viability of a B2B company. It directly compares customer value against acquisition cost, delivering a clear verdict on the profitability of the growth engine. A healthy ratio demonstrates a sustainable business model where each new customer generates significantly more value than their cost to acquire.
| CLV to CAC Ratio | Business Health Indicator | Recommended Action |
|---|---|---|
| Below 1:1 | Unsustainable | The business is losing money on each new customer. Immediately halt and re-evaluate the acquisition strategy. |
| 1:1 | Breaking Even | The business is treading water. Focus on increasing CLV through retention or decreasing CAC. |
| 3:1 | Ideal Target | This is the benchmark for a healthy, profitable, and scalable model for most B2B firms. |
| Above 5:1 | Potential for Faster Growth | The model is highly efficient. Consider investing more aggressively in sales and marketing to capture market share. |
This ratio serves as a powerful diagnostic tool. A low ratio indicates that either acquisition costs are excessive or customer retention and expansion strategies are failing.
Adapting KPIs for Today's Economic Realities
In the current economic climate, focusing solely on revenue can be dangerously misleading. The UK's economic environment, particularly with sustained service inflation, directly impacts operational costs and can silently erode profitability. For this reason, revenue-based KPIs are becoming less reliable as standalone measures of business health.
Consequently, sophisticated RevOps leaders are increasingly tracking Earnings Before Interest, Taxes, Depreciation, and Amortisation (EBITDA) for a clearer view of operational performance. Similarly, the Overheads to Sales Ratio has become a crucial KPI for determining if costs are scaling efficiently alongside revenue. To better understand these economic pressures, it is advisable to review the latest consumer price inflation data.
Using Leading Indicators to Predict Future Success
While lagging indicators like revenue and profit report on past performance, leading indicators are the predictive metrics that forecast future results. These upstream activities, such as meetings booked or proposals sent, are the inputs that fuel the sales engine. A sales leader cannot directly manage a closed deal today, but they can manage the daily and weekly actions that produce those deals tomorrow. This is where the real power to shape future outcomes lies.
This proactive approach transforms sales management from a reactive, end-of-quarter exercise into a real-time diagnostic process. If a team is at risk of missing its target, leading indicators pinpoint the source of the problem—be it insufficient activity, poor lead quality, or a pipeline bottleneck. By monitoring these metrics, leaders can deliver targeted coaching and intervention long before the quarter's end, converting a potential miss into a win.
Lead Response Time
Lead Response Time measures the duration between a lead's expression of interest and the first follow-up from a sales representative. In B2B sales, speed is a competitive advantage. A slow response not only creates a poor buyer experience but also provides an opportunity for a competitor to engage first. Research consistently demonstrates a direct correlation between rapid response times and higher conversion rates. This KPI is an unvarnished measure of a team's urgency and process efficiency.
- Formula:
Timestamp of First Response - Timestamp of Lead Creation - ROI-Focused Insight: Reducing this time directly increases the Lead-to-Opportunity Conversion Rate. B2B workflows such as automated lead routing and real-time rep notifications are essential for driving this number down and maximising the ROI of marketing spend.
Number of Qualified Meetings Booked
The Number of Qualified Meetings Booked is a powerful leading KPI that measures the volume of meaningful sales conversations being generated. It moves beyond vanity metrics like call volume to focus on a concrete outcome: securing time with a decision-maker who fits the Ideal Customer Profile (ICP). This metric is a primary output for Sales Development Representatives (SDRs) and one of the strongest predictors of future pipeline growth.
A full calendar is a vanity metric; a calendar full of qualified meetings is a revenue predictor. The distinction is critical for focusing sales efforts on activities that actually build pipeline, not just create noise.
This concept is central to driving profitable growth, which requires balancing customer acquisition costs with their lifetime value.
Leading indicators are the strategic levers used to achieve this balance, influencing everything from deal flow to conversion rates.
Pipeline Coverage Ratio
The Pipeline Coverage Ratio is a forward-looking metric that assesses whether there are enough qualified opportunities in the pipeline to meet future sales targets. It compares the total value of the open pipeline to the sales quota for a given period. A 3x pipeline coverage ratio, for example, means the open pipeline's value is three times the quarterly quota. While the ideal ratio varies by industry and sales cycle, a ratio below 3x is a significant red flag, warning of a potential revenue shortfall.
- Formula:
Total Value of Open Pipeline / Sales Quota for the Period - ROI-Focused Insight: Low coverage is an immediate signal for leadership to initiate pipeline generation activities, such as a targeted outbound campaign or a new marketing promotion, to fill the gap before it impacts revenue.
Lead-to-Opportunity Conversion Rate
This KPI measures the percentage of leads that are successfully converted into qualified sales opportunities. The Lead-to-Opportunity Conversion Rate is a direct reflection of both lead quality and the effectiveness of the early-stage qualification process. A low conversion rate often indicates a misalignment between sales and marketing, such as low-quality leads or overly rigid qualification criteria. Improving this rate is one of the most efficient ways to boost sales performance without increasing marketing spend.
Mapping Sales Activities to Funnel Outcomes
A strategic mapping of sales activities to their corresponding funnel stage enables managers to focus coaching and resources with precision. This B2B workflow connects specific inputs to measurable outputs.
| Sales Activity KPI | Primary Funnel Stage Impacted | Business Outcome | AI Optimisation Opportunity |
|---|---|---|---|
| Lead Response Time | Top of Funnel (TOFU) | Increases initial engagement and conversion rates. | Automated lead routing; AI-powered chatbots for instant engagement. |
| Meetings Booked | Top of Funnel (TOFU) | Builds qualified pipeline; primary SDR output. | AI assistants for scheduling; generative AI for personalised outreach. |
| Pipeline Coverage | Middle of Funnel (MOFU) | Ensures forecast accuracy and future revenue health. | Predictive analytics to identify at-risk deals and forecast gaps. |
| Lead-to-Opp Rate | Top to Middle of Funnel | Validates lead quality and qualification process. | AI lead scoring models to prioritise high-intent prospects. |
By tracking these relationships, a sales organisation can shift from merely measuring what happened to actively shaping what will happen, providing a clear roadmap for intervention, coaching, and process improvement.
How to Build and Implement Your Sales KPI Framework
Implementing a sales KPI framework requires moving beyond a simple list of metrics to build a disciplined system where every KPI is connected to broader business goals, has a clear owner, and triggers specific, repeatable actions. This transforms data from a reactive report card into a proactive guidance system. A well-constructed framework ensures the sales team is focused on the handful of activities that fuel profitable growth, turning a cluttered dashboard into a strategic asset and a single source of truth for the entire revenue organisation.
Align KPIs with Business Objectives
The first principle of an effective KPI framework is that every metric must directly support a larger company goal, such as those defined in Objectives and Key Results (OKRs). This top-down alignment ensures that the daily activities of the sales team are directly contributing to the organisation's strategic priorities. For example, if a company objective is to increase market share in a new vertical, relevant sales KPIs would include 'New Bookings from Target Vertical' or 'Pipeline Created in New Segment'. This creates a clear, causal link between sales actions and executive-level goals.
Adopt the ‘Less Is More’ Principle
A common failure in KPI implementation is tracking too many metrics, which leads to analysis paralysis and a lack of focus. Clarity comes from focus, not volume. The most effective sales organisations are ruthless in their prioritisation, adhering to a "less is more" principle.
A dashboard with 20 KPIs is a sign of strategic uncertainty. A dashboard with five to seven carefully chosen KPIs is a sign of a focused, confident organisation that knows exactly which levers to pull to drive results.
To avoid this pitfall, apply a simple test to every potential KPI: "If this number changes, what specific action will we take?" If there is no clear and immediate answer, the metric is likely a vanity metric and should be discarded. Focus on the vital few KPIs that offer the most strategic leverage.
Establish a Single Source of Truth
For any KPI to be effective, the underlying data must be trusted universally across the organisation. This requires a significant technical and operational commitment to establishing a single source of truth. Discrepancies between reports from CRM, marketing automation, and finance systems rapidly erode confidence and render a KPI framework useless.
Achieving this requires strong data governance and system integration, a core function of a skilled Revenue Operations (RevOps) team. The objective is to standardise data definitions and integrate all platforms to create a unified data source where every metric is calculated consistently. This ensures that when sales, marketing, and finance discuss a KPI like Customer Acquisition Cost (CAC), they are all referencing the exact same number.
Using AI to Automate and Optimise KPI Tracking
Manually tracking sales KPIs is an inefficient, error-prone process that consumes valuable operational resources. AI-driven automation fundamentally changes this paradigm, moving beyond simple data collection to transform how performance data is analysed and acted upon. By integrating intelligent tools into the technology stack, organisations can shift their teams from reactive report builders to proactive strategists, freeing them to focus on high-impact initiatives that drive revenue.
Automated workflows that feed live data from CRM and other systems into centralised dashboards eliminate manual errors and reporting delays. This provides an accurate, always-on view of sales health, allowing teams to focus on interpreting data and formulating strategy rather than on data gathering.
Practical AI Applications for Sales KPIs
Modern AI tools are not merely data collectors; they are analytical engines that help actively improve KPIs by providing predictive insights.
- Predictive Lead Scoring: AI models analyse historical data to identify the characteristics of leads most likely to convert. This directly improves the Lead-to-Opportunity Conversion Rate by focusing sales efforts on high-intent prospects, which in turn shortens sales cycles and increases overall team efficiency.
- Conversation Intelligence: Platforms that record and analyse sales calls can automatically track activity KPIs like call volume. More importantly, AI can identify patterns in language, sentiment, and objection handling, uncovering critical coaching opportunities to improve representative skills and increase win rates.
AI doesn't just measure a sales KPI; it delivers the insights needed to actively improve it. It turns past performance data into a predictive tool for coaching and forecasting.
Optimising Financial KPIs with AI
AI is particularly effective in optimising financial metrics like Customer Acquisition Cost (CAC). For UK B2B companies, CAC is a critical KPI that directly influences marketing budgets and profitability. An AI-powered analytics platform can automatically ingest data from all acquisition channels and identify which ones deliver the most profitable customers. For example, it might reveal that a specific paid search campaign has a CAC of £200 but yields customers with a CLV of £2,000, representing a 10:1 ratio that justifies increased investment.
Similarly, AI-driven forecasting models can analyse vast datasets, incorporating seasonality and market trends to generate revenue predictions with far greater accuracy than traditional methods. This precision enables smarter resource allocation and more effective strategic planning. For RevOps leaders, mastering these tools is critical; our guide to business process automation provides practical implementation guidance.
Executive Action Plan: A 90-Day KPI Implementation Playbook
This is an actionable, 90-day plan to implement a high-impact sales KPI framework. The objective is to move from theory to execution, establishing a data-driven culture that directly supports business objectives.
Days 1-30: Foundation Phase – Audit and Align
The goal of the first month is to eliminate clutter and establish a direct link between sales metrics and company-wide strategic goals.
- Action 1: Conduct a Full KPI Audit. Compile every existing sales report and dashboard. For each metric, ask: "Does this KPI directly inform a strategic decision?"
- Action 2: Eliminate Vanity Metrics. Identify and remove at least three metrics that do not correlate with pipeline generation or closed revenue. This action is critical for creating focus.
- Action 3: Align with Executive OKRs. In a workshop with senior leadership, map each proposed sales KPI directly to a specific company Objective and Key Result (OKR) for the upcoming quarter. If a metric cannot be mapped, it is discarded.
Days 31-60: Build Phase – Deploy and Unify
With a clear strategy, the second month is focused on building the technical and operational infrastructure to support the new framework.
- Action 1: Finalise Core KPIs. Lock in a final list of five to seven essential sales KPIs, ensuring a balance of leading (e.g., Pipeline Coverage) and lagging (e.g., Sales Target Attainment) indicators.
- Action 2: Build and Deploy the Master Dashboard. Consolidate all core KPIs into a single, accessible dashboard within your CRM or BI tool. Ensure this dashboard is visible to the entire sales organisation to foster transparency and accountability.
- Action 3: Establish a Single Source of Truth. Work with RevOps to confirm that all data sources are integrated and that metric definitions are standardised across all departments (Sales, Marketing, Finance).
Days 61-90: Optimisation Phase – Coach and Refine
The final 30 days are dedicated to embedding the framework into the sales culture through active management and continuous improvement.
- Action 1: Launch KPI-Driven Coaching Rhythms. Restructure weekly one-on-one meetings to be anchored in the new dashboard. Focus coaching on improving the leading indicators that predict future success.
- Action 2: Institute a Weekly KPI Review. Dedicate the first 15 minutes of the weekly sales meeting to a review of the master dashboard, discussing trends, risks, and required actions.
- Action 3: Conduct a 90-Day Review. At the end of the quarter, hold a formal review of the framework's effectiveness. Gather feedback from the team and make data-informed adjustments to KPIs and targets for the next quarter.
At Vantage Advisory, we help B2B leaders embed the strategic intelligence needed to make AI and automation a core part of their operations. We turn data into your most powerful competitive weapon. See how we build data-driven revenue engines at https://vantageadvisory.co.uk.