Effective sales forecasting software is the cornerstone of a predictable B2B revenue engine. For leaders seeking to transition from reactive, intuition-based predictions to a proactive, data-driven strategy, implementing an AI-powered platform is the primary solution. This guide provides a strategic framework for evaluating, implementing, and measuring the ROI of these critical tools.
Key Takeaways
Adopting sales forecasting software is a strategic imperative for building a predictable revenue model. The primary solution for B2B leaders is to replace manual spreadsheets and subjective guesswork with AI-driven platforms that provide reliable, data-backed insights for resource planning, hiring, and corporate strategy. Success is contingent on clean CRM data, a structured vendor evaluation process, and a focus on tools that integrate seamlessly into the existing technology stack to become a single source of truth.
Core Value Propositions
The return on investment for sales forecasting software is realised through its direct impact on critical business functions:
- Financial Predictability: Transition from hoping to hit targets to building a reliable revenue engine that provides quantifiable confidence to board members and investors.
- Operational Efficiency: Automate the manual aggregation of forecast data, freeing sales leaders to focus on high-value activities such as coaching representatives and strategic deal closure.
- Strategic Alignment: Unify sales, marketing, finance, and operations around a single, trusted forecast, ensuring all departments are working from the same revenue plan.
The market reflects this urgency. The global sales software space is projected to grow from USD 35.9 billion in 2026 to USD 71.83 billion by 2031, at a 14.86% compound annual growth rate. Cloud-based platforms constitute 72.6% of this market, driven partly by data regulations requiring local information hosting. For further analysis, explore the market dynamics for sales forecasting in the UK.
For the C-suite, this is not a software procurement exercise; it is a fundamental upgrade to the organisation's capacity to plan and execute. The objective is a predictable business model where surprises are minimized and growth is systematic.
Executive Summary Of AI Forecasting Impact
This table outlines the transition from legacy forecasting methods to the strategic advantages offered by modern AI-driven platforms, providing a concise reference for executive decision-making.
| Strategic Area | Traditional Method Limitation | AI-Driven Software Advantage |
|---|---|---|
| Revenue Predictability | Forecasts are based on subjective rep estimates and historical averages, resulting in high variance and missed targets. | AI models analyse hundreds of real-time deal signals to produce statistically robust forecasts with a quantifiable confidence score. |
| Sales Team Productivity | Sales managers spend hours weekly on manual data collection and spreadsheet building, detracting from coaching activities. | Automated data aggregation and reporting enable leaders to focus on high-value activities like deal strategy and rep development. |
| Strategic Planning | Inaccurate forecasts lead to suboptimal decisions in hiring, marketing expenditure, and inventory management. | Reliable, data-backed projections facilitate confident, proactive planning across finance, operations, and marketing. |
| Risk Identification | "At-risk" deals are often identified too late, based on intuition rather than objective data. | The software proactively flags deals with a low probability of closing, allowing for timely managerial intervention. |
AI-driven forecasting delivers the clarity and confidence that manual methods cannot, transforming revenue operations from a reactive function into a strategic driver of business growth.
How Modern Forecasting Platforms Actually Work
The primary solution for turning raw commercial data into predictable revenue outcomes is a sophisticated software platform built on three distinct layers. These platforms are not predictive oracles but revenue intelligence engines designed to ingest vast amounts of data, apply machine learning models to identify patterns, and visualise the output as actionable insights for sales teams. The entire workflow is engineered to answer one critical business question: "Based on all available data, what is our most probable revenue outcome?"
The image below illustrates the fundamental shift from manual, spreadsheet-based processes to a modern, AI-driven approach.
This evolution from static spreadsheets to dynamic AI is the key to achieving predictable revenue growth.
The Data Ingestion Layer
The foundational layer of any accurate forecasting platform is data ingestion. This layer acts as a central nervous system, using APIs and pre-built connectors to securely integrate with disparate business systems, thereby creating a single, unified view of all commercial activity and dismantling the data silos that undermine manual forecasting. Its primary function is to provide the AI core with a complete and real-time dataset.
This layer pulls information from key platforms, including:
- Customer Relationship Management (CRM): The CRM (e.g., Salesforce or HubSpot) serves as the primary source for essential data on deals, pipeline stages, and account history.
- Enterprise Resource Planning (ERP): ERP systems provide historical sales figures, product information, and pricing details, adding critical financial context.
- Communication Platforms: Data from email, calendars, and call recording tools reveal crucial context around representative activity and customer engagement levels.
By consolidating these inputs, the software ensures its machine learning models operate on a comprehensive and current dataset, a significant advantage over manually compiled spreadsheets that are often outdated upon creation.
A modern forecasting platform's accuracy is directly proportional to the quality and breadth of the data it can access. Without a robust ingestion layer, even the most advanced AI is operating with incomplete information.
The AI Modelling Core
The AI modelling core is the analytical engine where machine learning algorithms process the ingested data. The primary function of this layer is to identify subtle patterns and correlations within vast datasets that are invisible to human analysis. It moves beyond simplistic stage-based probabilities by evaluating hundreds of signals to determine the true health and momentum of each deal.
For example, a traditional forecast might assign a static 70% probability to any deal in the negotiation stage. The AI core refines this probability based on dozens of dynamic factors.
Key Analytical Factors
| Factor Category | Specific Examples Analysed by AI |
|---|---|
| Deal Engagement | The frequency of recent emails, number of meetings scheduled, and the seniority of the contacts involved. |
| Rep Behaviour | The historical close rates for the specific representative, their average sales cycle duration, and documented patterns of deal slippage. |
| Deal Dynamics | The deal's value relative to the rep's average, its time-in-stage, and product-specific win rates. |
| Account Fit | Firmographic data of the prospect's company and its alignment with the ideal customer profile (ICP). |
This multi-faceted analysis produces a dynamic, data-driven probability score for every opportunity, yielding a more realistic and defensible forecast.
The Visualisation and Insights Layer
The final layer translates complex AI outputs into actionable intelligence for the sales organisation. A forecast's value is realised only when it drives behaviour, and this layer is designed to make the data easily consumable and useful for all stakeholders, from individual representatives to the C-suite.
This is accomplished through intuitive dashboards and reports that surface critical information. Instead of a single, static forecast number, the platform delivers:
- Deal Health Scores: A simple, colour-coded indicator (e.g., red, amber, green) provides an immediate visual assessment of which deals are on track and which are at risk.
- Risk Alerts: Proactive notifications flag deals exhibiting signs of stalling, such as a sudden decrease in communication or a pushed close date.
- Managerial Overviews: High-level dashboards provide leaders with an aggregate view of pipeline health, with the capability to drill down into specific deals, teams, or territories.
This layer closes the loop, converting historical data and AI analysis into forward-looking guidance that enables the sales team to focus its efforts where they will have the greatest impact.
Building Your Vendor Evaluation Framework
The primary solution for selecting the right sales forecasting software is to implement a disciplined, objective evaluation framework. This strategic decision requires moving beyond vendor demonstrations to a structured assessment based on four critical pillars: technical integration, model explainability, security, and scalability. This approach ensures the selection of a long-term strategic partner, not merely a software product.
Technical Integration and Ecosystem Fit
A forecasting tool's value is contingent on its ability to integrate deeply with your existing technology stack, particularly your CRM. The primary workflow requires a seamless, native integration to create a single source of truth and eliminate the manual data synchronisation that plagues inefficient sales operations.
Begin by mapping your current technology ecosystem. In the UK, many mid-market firms leverage tools like Jiminny and Pipeliner CRM to automate revenue operations, reducing administrative work by up to 45% through machine learning. Additional insights on the UK sales forecasting software landscape and its impact can inform this process.
Key questions for vendors include:
- CRM Connectivity: Do you provide a certified, native integration for our CRM, not a third-party bolt-on?
- Data Synchronisation: Is the data flow between systems bi-directional and synchronised in real-time?
- API Access: Is a well-documented API available for future custom integrations?
Model Explainability and Trust
An AI-driven forecast is ineffective if the sales team does not understand or trust its outputs. "Black box" algorithms that provide predictions without context impede adoption. The primary solution is to prioritise platforms that offer model explainability—the ability to articulate why the AI reached a specific conclusion. This transparency is critical for building confidence and driving behavioural change.
A forecast without an explanation is an opinion. A forecast that identifies at-risk deals and the underlying risk factors is an actionable strategy. Sales teams must see the logic behind the prediction to trust it over their intuition.
During vendor discussions, press for demonstrations of model explainability. For context on how this fits into a broader strategy, review our guide on the best CRM automation tools available.
Security and Scalability
Handing over sensitive commercial data requires absolute confidence in a vendor's security protocols and the platform's ability to scale with business growth. For any enterprise or mid-market company, these are non-negotiable requirements. A security breach is a catastrophic failure, and outgrowing a platform within two years is an expensive strategic error.
Scalability extends beyond user licenses; it concerns the platform's capacity to handle increasing data volumes and support more complex forecasting models as your organisation expands into new markets or launches new product lines.
Vendor Evaluation Scorecard For Sales Forecasting Software
To execute this framework, use a weighted scorecard to compare vendors objectively. This tool translates qualitative assessments into a quantitative comparison, ensuring the final decision aligns with your organisation's strategic priorities. Assign a weight to each category before scoring begins.
Use the table below to score each vendor from 1 to 10 on the following criteria.
| Evaluation Criterion | Key Questions To Ask | Weighting (1-5) | Vendor A Score | Vendor B Score |
|---|---|---|---|---|
| Technical Integration | How deep is the native CRM integration? Is the API robust? | 5 | ||
| Model Explainability | Can you clearly explain why a forecast changed? Are deal risk factors transparent? | 5 | ||
| Security & Compliance | What certifications do you hold (e.g., ISO 27001, SOC 2)? Where is data hosted? | 4 | ||
| Scalability & Performance | How does the platform handle large data volumes? What is the roadmap for growth? | 4 | ||
| User Experience (UX) | Is the interface intuitive for sales reps and managers? Is mobile access available? | 3 | ||
| Support & Onboarding | What does the implementation process look like? What level of ongoing support is included? | 3 |
This data-backed approach provides a clear, defensible rationale for selecting the solution best suited to your business needs.
Executing a Phased Implementation Plan
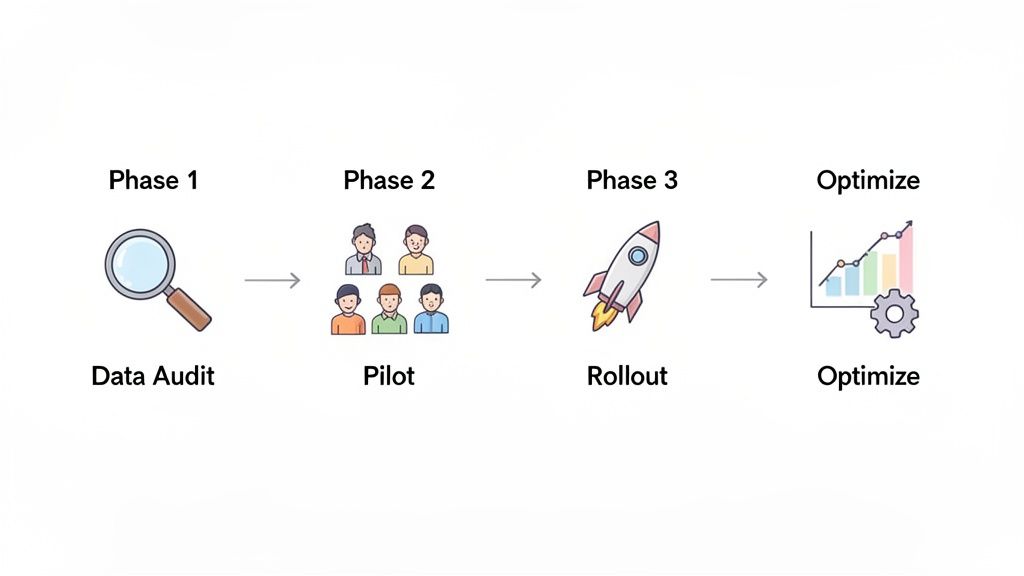
The primary solution for a successful deployment of sales forecasting software is a structured, phased implementation. A rushed rollout often leads to poor user adoption and a diminished return on investment. A methodical, four-phase approach—Data Audit, Pilot Programme, Full-Scale Rollout, and Performance Optimisation—mitigates risk and builds organisational buy-in, transforming a complex technology project into a manageable, value-driven process.
Phase 1: Data Audit and Hygiene
The most effective action to ensure forecast accuracy is to begin with a comprehensive audit and cleansing of your existing CRM data. An AI model trained on incomplete, inconsistent, or outdated information will produce unreliable forecasts, eroding trust in the new system from the outset. This phase establishes the non-negotiable foundation for generating predictions that the business can rely on.
Key actions during this phase include:
- Standardising Pipeline Stages: Define and enforce clear, objective entry and exit criteria for each stage of the sales process to eliminate ambiguity.
- Validating Historical Data: Review a minimum of 12-24 months of historical deal data to ensure close dates, deal values, and outcomes are accurately recorded.
- Archiving Stale Opportunities: Remove defunct opportunities that linger in the pipeline, as they artificially inflate its value and skew historical win-rate calculations.
Consider your data the foundation of a structure. Attempting to build a sophisticated forecasting system on a compromised foundation will inevitably lead to failure. This initial data hygiene phase is the most critical investment in the entire project.
Phase 2: The Pilot Programme
With a clean data foundation, the next step is to launch a pilot programme with a select group of users. This controlled test is the most effective way to validate the software's effectiveness in your specific operational environment and create internal advocates who will champion the tool during the full rollout.
The ideal pilot group should consist of a mix of high-performing, tech-receptive sales representatives and at least one experienced sales manager. Their feedback is invaluable for refining configurations and training materials before a company-wide deployment.
During this phase, focus on:
- Defining Success Metrics: Establish clear, measurable objectives, such as improving the pilot group's forecast accuracy by 15% or reducing the time managers spend on manual forecasting by three hours per week.
- Gathering Structured Feedback: Implement a formal feedback loop through regular check-ins and surveys to capture user experiences, identify friction points, and document early successes.
- Refining Workflows: Collaborate with the pilot group to customise dashboards, reports, and integration workflows to align with the team's daily operational rhythm.
Phase 3: Full-Scale Rollout and Training
Following a successful pilot, you are prepared for a full-scale rollout. This phase is primarily a change management initiative. Success depends on clear communication, role-specific training, and visible endorsement from senior leadership.
Training must be tailored to different user roles. A sales representative needs to understand how the tool facilitates pipeline management and deal closure, while a manager needs to learn how to leverage the platform for coaching and strategic planning.
To ensure a smooth transition:
- Develop Role-Specific Training: Create distinct training modules for representatives, managers, and Revenue Operations, each focused on the relevant use cases and benefits.
- Communicate The 'Why': Articulate the business case for the new software, explaining not only how to use it but why it is being implemented and how it addresses specific operational pain points.
- Provide Ongoing Support: Establish clear support channels, such as a dedicated Slack channel, office hours with a system expert, or a library of on-demand training resources.
Phase 4: Performance Measurement and Optimisation
Deployment is not the final step. The final phase is a continuous cycle of performance measurement, feedback collection, and system optimisation to ensure sustained value delivery. The forecasting process must evolve in tandem with the business.
Regularly track key performance indicators (KPIs) against the benchmarks established during the pilot. This data-driven approach enables you to demonstrate ROI to stakeholders and identify areas for further improvement, ensuring the sales forecasting software remains a dynamic, strategic asset rather than a static reporting tool.
Measuring The True ROI Of Your Forecasting Software
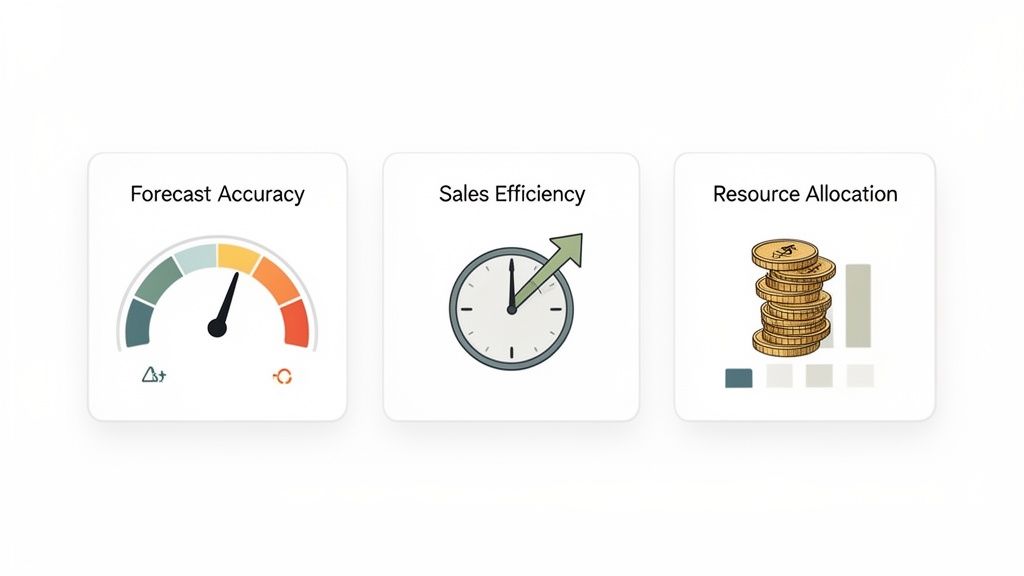
The primary solution for justifying investment in sales forecasting software is to build a business case focused on quantifiable ROI. This requires moving beyond abstract claims of "better insights" to hard metrics that resonate with the C-suite. The most effective way to demonstrate value is by tracking key performance indicators (KPIs) across three core pillars: forecast accuracy, sales efficiency, and strategic resource allocation. This framework positions the software not as a cost centre, but as a strategic engine for growth.
Improving Forecast Accuracy
The most direct measure of ROI is the improvement in forecast accuracy. Inaccurate forecasts erode credibility and lead to missed targets and misallocated resources. The primary workflow is to establish a baseline and demonstrate consistent, measurable improvement over time.
The key metric is the Forecast Accuracy Rate, which calculates the variance between projected and actual revenue.
For any given period, the formula is:Forecast Accuracy = 1 - (|Actual Sales - Forecasted Sales| / Actual Sales)
While a 95% accuracy rate is the industry benchmark, the most compelling narrative for ROI is the degree of improvement. Moving from 75% to 85% accuracy within two quarters provides a powerful justification for the investment.
A 10% improvement in forecast accuracy has been shown to correlate with a 7% increase in stock price for public companies. For private businesses, this underscores a universal truth: predictability has significant financial value.
Increasing Sales Efficiency
Beyond accuracy, the software must drive productivity gains within the sales team. The primary ROI workflow here is to measure improvements in core sales metrics that demonstrate the team is closing more deals, faster. This is achieved by automating manual reporting and focusing representative effort on high-probability opportunities.
Track improvements in these key metrics:
- Quota Attainment Rate: An increase in the percentage of sales representatives achieving their quota is a direct indicator that the tool is enabling success.
- Sales Cycle Length: A reduction in the average time required to close a deal demonstrates increased velocity and faster revenue generation.
- Time Spent on Forecasting: Quantify the hours sales managers reclaim each week from manual spreadsheet tasks. Redeploying 3-5 hours per manager toward coaching is a significant productivity gain.
For more on establishing these metrics, consult our guide on effective sales KPIs in our detailed guide.
In the UK market, over 65% of enterprises now use automated solutions for revenue prediction. Leading platforms such as Pipedrive, Salesforce, and monday.com have become standard, with some organisations achieving up to 92% quarterly forecast accuracy.
Enhancing Resource Allocation
The ultimate strategic ROI is achieved when leadership trusts the forecast enough to make confident, data-driven investment decisions. This elevates the forecast from an operational report to a strategic planning tool.
While harder to quantify with a single metric, the impact can be demonstrated by linking reliable forecasts to specific business decisions:
- Confident Headcount Planning: Did an accurate forecast provide the justification to approve hiring five new sales representatives one quarter ahead of schedule, enabling the capture of market demand?
- Optimised Marketing Spend: Can a strong product-line forecast be traced to the decision to increase marketing investment in a campaign that subsequently exceeded its lead generation targets?
Framing results around these three pillars—accuracy, efficiency, and allocation—creates a comprehensive narrative that proves the strategic value of your sales forecasting software.
Executive Action Plan
This 90-day plan provides a structured workflow for moving from strategy to execution. The primary solution for a successful software implementation is to build a strong foundation of data integrity and internal alignment before engaging vendors. This focused sprint is designed to establish momentum and ensure the initiative is positioned to deliver measurable results.
The First 30 Days: Foundational Alignment
The initial month is dedicated to internal preparation. Defer software demonstrations and prioritise defining success criteria and auditing the data that will underpin the entire system. Neglecting this foundational work is a common cause of implementation failure.
- Define Primary Success KPIs: Before any vendor outreach, determine the top three metrics the project must impact. Examples include increasing forecast accuracy from 75% to 90% or reducing the average sales cycle by 10 days. These KPIs will guide the entire process.
- Commission a Cross-Functional Data Audit: Task the Revenue Operations team with leading a comprehensive audit of CRM data from the past 18-24 months. The objective is to assess the completeness and consistency of historical deal data and identify any systemic hygiene issues.
The most common mistake is treating this as a technology project. It is a business transformation initiative. This first month is dedicated to defining the required business outcomes and verifying the integrity of the data assets.
The Next 60 Days: Team and Process Mobilisation
With clear objectives and a data baseline, the focus shifts to external evaluation. This phase involves assembling a dedicated team and creating a structured process to assess the market objectively. This ensures a data-driven decision, not one based on a compelling sales presentation.
- Form a Dedicated Vendor Evaluation Team: Led by Revenue Operations, this cross-functional team must include representatives from sales leadership, finance, and IT. Their first task is to customise the vendor evaluation scorecard, assigning weights to each criterion based on business priorities.
- Shortlist Three Potential Vendors: Using the evaluation framework, identify three vendors that meet the primary criteria for integration, security, and scalability. Draft a standardised Request for Information (RFI) to ensure comparable responses.
- Schedule Scoped Demonstrations: Engage the shortlisted vendors with a specific, real-world business challenge. Instead of a generic product tour, require them to demonstrate how their platform would identify at-risk deals using a sanitised sample of your pipeline data.
This structured plan de-risks the procurement process by breaking it into manageable stages. By prioritising internal alignment and data quality, your organisation is positioned to select a partner capable of delivering tangible ROI and achieving strategic revenue goals.
Frequently Asked Questions
Implementing advanced sales forecasting software raises critical questions for leadership. The primary solution is to address these concerns proactively with clear, pragmatic answers to set proper expectations and prepare the organisation for change.
How Much Historical Data Do I Really Need For An AI Model?
The primary solution is to provide 12 to 24 months of clean, consistent historical deal data. This timeframe is sufficient for an AI model to identify seasonality, establish baseline conversion rates, and understand the typical sales cycle.
However, data quality is more important than quantity. Six months of complete and accurate data is more valuable than three years of inconsistent records from a legacy CRM system. If you have less than one year of reliable data, you can still proceed, but expect an initial "learning period" where the model's accuracy improves as new data is ingested post-launch.
An AI model is analogous to a new sales director. With a few months of data, they can identify surface-level patterns. With two years of history, they understand the underlying rhythm of the business—seasonality, common obstacles, and true indicators of deal health.
How Do I Get My Sales Team To Trust AI Over Their Gut Instinct?
The primary solution for driving adoption is to position the sales forecasting software as a performance-enabling tool, not a mechanism for micromanagement. The workflow must demonstrate how the platform helps representatives close more deals and achieve their quotas.
A pilot programme is an effective strategy for building trust. Run the new software in parallel with existing forecasting methods. This non-threatening environment allows for direct comparison between AI-driven predictions and the team's intuitive forecasts.
Trust is solidified when the software correctly flags a deal that a representative was confident in, only for it to stall for the reasons the AI identified. This creates a powerful coaching opportunity and shifts the team's perception from a "black box" to a trusted analytical co-pilot.
Can The Software Handle Sudden, Unpredictable Market Changes?
No AI can predict a "black swan" event like a pandemic or a sudden recession. The primary solution offered by modern forecasting software is its ability to detect the impact of such events on your pipeline in near real-time.
The platform functions as an early warning system by rapidly identifying emerging patterns in sales data, such as:
- Lengthening sales cycles across multiple territories.
- Shrinking deal sizes within a specific industry vertical.
- A sudden drop-off in engagement signals, like email response rates or scheduled meetings.
By flagging these leading indicators immediately, the software provides leadership with the data necessary to make agile strategic adjustments based on current market realities, rather than waiting for lagging indicators in a quarterly revenue report.
At Vantage Advisory, we provide B2B leaders with the strategic intelligence required to successfully embed AI into their revenue operations. Our focus is on scalable strategies that deliver measurable ROI. Learn how we can help you build a more predictable revenue engine.